DiskPulse Server Statistical Charts | ||||||||
|
Disk change monitoring reports saved in the reports database may be searched, analyzed and exported to a number of standard formats such as HTML, PDF, text, Excel CSV and XML. In addition, the user is provided with the ability to analyze series of disk change monitoring reports and display pie charts or bars chars showing the number of changes per file extension, change type, user name or file category. 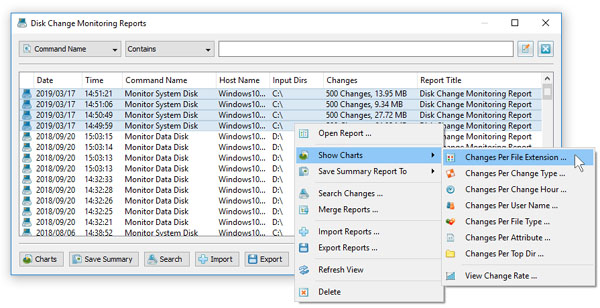
For example, in order to display a pie chart showing the number of changes per file extension in a number of disk change monitoring reports, open the 'Reports' dialog, select all the required disk change monitoring reports, press the right mouse button and select the 'Show Charts - Changes Per File Extension' menu item. 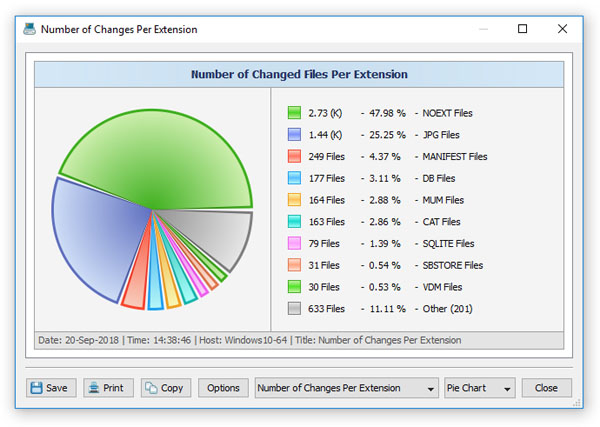
DiskPulse Server will analyze all the selected disk change monitoring reports and display a consolidated pie chart showing the number of file system changes per file extension. The charts dialog allows one to copy the chart image to the clipboard, print the chart image and edit various chart options. In the same way, the user can display pie charts or bars charts showing the number of changes per file category, user name and change type. Timeline Charts Another option is to display timeline charts showing the number of disk changes and the amount of changed disk space per change hour. For example, open the reports dialog, select a number of disk change monitoring reports, press the right mouse button and select the 'Show Charts - Changes Per Change Hour' menu item. 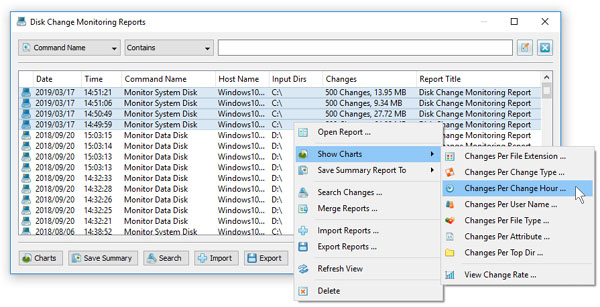
DiskPulse will scan the selected disk change monitoring reports and display a chart dialog showing a 24-hours timeline showing the number of disk changes per hour. In order to display the amount of changed disk space, set the chart mode combo box to 'Changed Disk Space Per Change Hour'. 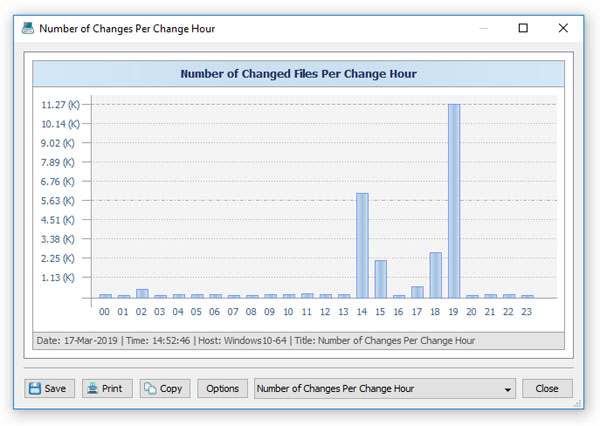
In addition, the timeline chart dialog provides the ability to export the chart data to a number of different formats, export the chart image to the BMP, JPEG and PNG image files and copy the displayed chart image to the clipboard allowing one to easily integrate DiskPulse charts into user's documents and presentations. In order to customize the chart's description, press the 'Options' button and specify a custom chart title, host name, date or time.
|
|
|

|

